On April 27, 2026, GitHub announced that Copilot is moving to usage-based billing on June 1, 2026. Premium request units are out; GitHub AI Credits consumed by token are in. For organizations running agentic workflows, this isn’t a pricing footnote, it’s a structural shift in how AI costs compound. The patterns in this post aren’t just good practice anymore. They’re the operational response.
In our previous posts, we introduced the three pillars of trust that make agentic delivery safe, mapped the maturity ladder from foundation to autonomy, and showed how the planning tax bottlenecks delivery before a single line of code is written. But one conversation keeps stalling in leadership meetings:
“My board wants AI ROI numbers. I have dashboard metrics and developer surveys. Neither tells me the business value of a specific feature delivered with AI.”
The answer requires treating ROI measurement and cost governance as infrastructure, not a quarterly exercise. We built an enterprise agentic orchestration framework to solve exactly this problem, and the patterns we discovered apply to any organization scaling AI-assisted delivery. This post explains why current measurement approaches leave critical gaps, what per-feature economics look like in practice, why conservative numbers earn more trust than impressive ones, and how proactive cost controls prevent agentic workflows from consuming budgets faster than they create value.
The Measurement Gap
Most organizations measure AI coding ROI through two channels: platform dashboards and developer surveys.
Platform dashboards are a genuine step forward. They provide real metrics like adoption rates, acceptance percentages, and seat usage. These are automatically collected and useful for answering a specific question: is the tool being used?
Developer surveys add perceived impact. Developers estimate time saved, the results are averaged and multiplied by headcount, and a slide claims, “developers report 30% faster completion, saving an estimated $X per quarter.”
Both sources are legitimate. Neither answers the question leadership needs answered next.
- Gap 1: Activity is not value. A 40% suggestion acceptance rate tells you the tool is in use, not whether a specific feature was delivered faster or what the dollar return was.
- Gap 2: Aggregation hides variation. A developer who saved four hours on a complex feature is averaged with one who lost thirty minutes chasing a hallucinated suggestion.
- Gap 3: No per-feature auditability. When a CFO asks, “what was the return on that specific initiative?”, neither dashboards nor surveys provide a per-feature financial transaction with traceable inputs.
- Gap 4: No per-feature cost attribution. Organizations know their monthly AI subscription cost. Few know what a single agentic workflow costs to run against a specific feature, or which workflows consume the budget fastest.
Dashboard metrics proved adoption. Now leadership needs the next layer: per-feature economics that connect AI-assisted delivery to auditable business outcomes and auditable costs.
Signal-Based Estimation: How Per-Feature Economics Work
The alternative to dashboards and surveys is per-feature economics: automatic ROI calculation on every unit of work that passes through an AI-assisted workflow.
Instead of measuring tool activity or asking developers to estimate savings, the system calculates value from concrete signals extracted during the workflow itself. The critical shift is from generic complexity tiers (“this looks like a medium task”) to estimation driven by actual data from the feature’s own analysis artifacts: implementation scope, number of components affected, complexity indicators, and security findings actually detected. These signals already exist inside modern developer workflows. GitHub pull requests, code review activity, security scans, and Copilot-assisted changes provide the raw execution telemetry. Agentic orchestration turns that telemetry into structured inputs that teams can use.
Every variable has a documented rate, a research citation, and a defined range with floors and ceilings. A reviewer does not need to trust the output. They can rerun the formula with their own rates and check whether the conclusion changes.
Here is what a single ledger entry looks like for a mid-sized feature affecting five components:
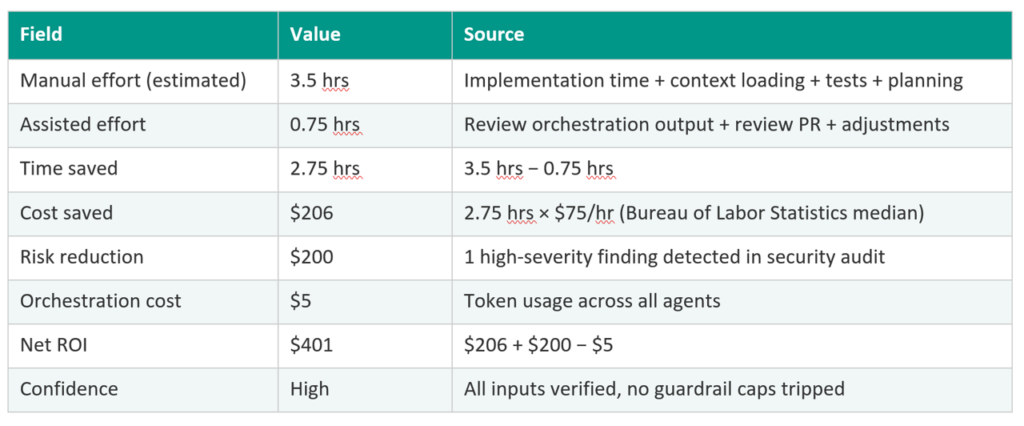
This is not a dashboard metric. It is a financial transaction with an auditable methodology. Every field traces to a cited source. Every rate can be challenged independently.
Implementation time derives from estimated scope using research-backed productivity rates (McConnell, 2004). The estimate adjusts for the number of components affected and the type of complexity involved, such as changes to public interfaces or state management. Risk reduction counts only actual findings, not hypothetical prevention. The full methodology is documented alongside each calculation so reviewers can verify or dispute any input.
The Anti-Inflation Principle
Per-feature economics solve the collection problem. They introduce a new risk: inflated numbers.
AI systems that calculate their own ROI have an obvious incentive problem. If the calculator is generous with assumptions, the numbers look better. Over time, stakeholders notice the inflation, and the measurement system loses credibility. The tool meant to prove value instead undermines trust.
The solution is anti-inflation infrastructure: hard caps, sanity checks, and conservative defaults built into the calculation methodology at the architectural level. In our work with enterprise engineering organizations, this is where most measurement initiatives fail. They get the collection right and the credibility wrong. Three design principles make it work:
- Cap the ceiling. No single calculation can claim more than 75% time savings. That ceiling is derived from peer-reviewed research on AI-assisted coding productivity (Peng et al.). If raw numbers exceed the cap, the system adjusts automatically. This is enforcement, not guidance.
- Count only what actually happened. Risk reduction value is $0 when scans are clean. “The scan found nothing” is a process benefit, not a financial event. Only actual findings produce dollar values. Hypothetical prevention is not a line item.
- Require the methodology to travel with the number. Every calculation includes documented assumptions and caveats. A $401 savings with documented caveats is worth more in a board meeting than an $800 savings with none. Every rate traces to a research citation that reviewers can check, challenge, and replace.
The key insight: conservative beats impressive. A CFO who sees $330 average per feature with documented assumptions will trust the number. A CFO who sees $1,200 with no methodology will not. The smaller number that survives interrogation is worth more than the larger number that cannot.
The GitHub Credits Shift: Why Agentic Costs Just Changed
Per-feature ROI measurement is half the infrastructure. The other half is cost governance, and the industry shift to token-based billing makes it urgent.
GitHub’s June 1 transition from flat-seat to credit-based billing is exactly the scenario this section describes. Every agentic workflow your team runs will now draw from the same shared credit pool your developers use for daily coding assistance, billed by token, not by seat.
AI platforms are moving from flat-rate seat pricing to consumption-based billing, where every API call consumes credits from a shared organizational pool. For a single developer using an IDE assistant, the cost impact is modest. For agentic workflows that orchestrate dozens of AI calls per feature, the economics change fundamentally.
The shared pool problem. AI credits are pooled across the entire organization, not allocated per team. One multi-agent workflow processing a complex feature can consume credits that hundreds of developers need for daily coding assistance. Without governance, a single busy repository can exhaust a team’s monthly allocation in a day. This is not a theoretical concern. It is the default behavior when agentic orchestration runs without budget controls.
Nondeterministic costs. When a developer types a prompt in an IDE, the cost is roughly predictable: one model call, one response. When an agentic workflow processes a feature, a single orchestrating agent can spawn dozens of subagents, each making its own model calls. Those subagents may run in parallel, generate competing outputs, or retry on failure. The total token consumption compounds through the subagent tree, and the variance can be 3-5x between a simple feature and a complex one.
Premium model bias. Model routers are designed to select the most capable model available. Without explicit tier constraints, every agent call defaults to the most expensive option, even when a less powerful model would produce equivalent results for that specific task.
The mid-pipeline halt trap. Budget thresholds that stop execution when credits are exhausted sound like responsible governance. In practice, they create a worse outcome: all credits spent on completed stages are wasted because the workflow never finishes. A pipeline that ran eight agents at premium cost before halting has consumed 80% of the budget and produced zero deliverable value. Halting mid-execution is more expensive than completing with cheaper models.
These four problems share a root cause: cost governance that reacts after spend has occurred rather than planning before execution begins.
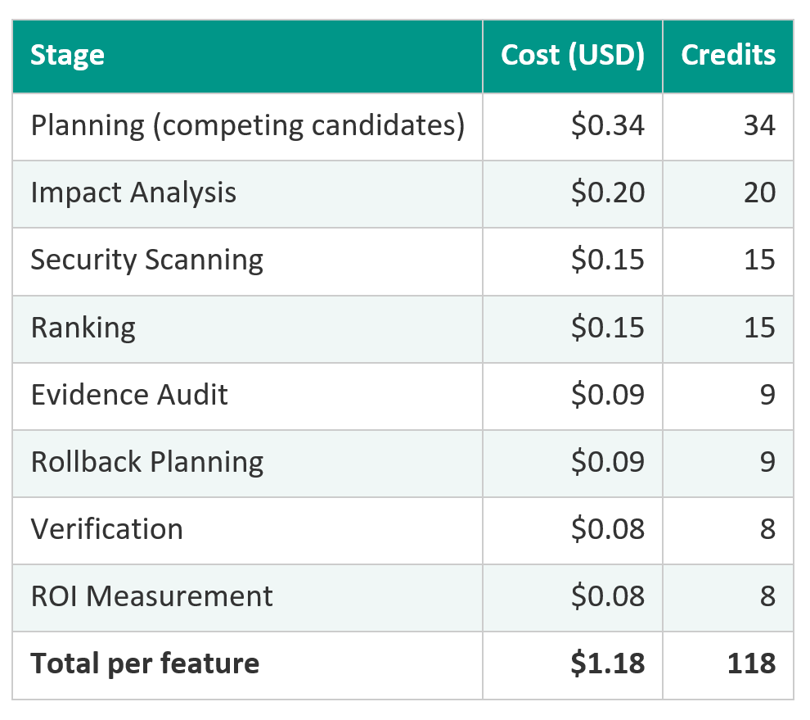
Knowing What It Costs – Before You Spend It
When a multi-agent workflow processes a feature, each stage consumes tokens. The total is calculable: